An article by Sreejith Balasubramanian, Economist – Fund Management, IDFC AMC
India’s November CPI (Consumer Price Index) at 4.9% y/y was below consensus and our expectation, although it picked up from 4.5% in October. While momentum in food prices was a bit lower than expected, it was the fuel and light basket which really surprised with a sequential contraction. However, core CPI (headline excluding food and beverages, fuel and light) at 6.1% continued to be persistently high, particularly of concern in the context of recovering demand, and highlighted by the RBI Governor in his most recent monetary policy statement. Notwithstanding the slight ‘dovish’ surprise of the November print, reasons for which we investigate below, several factors tilt the CPI’s balance towards a higher trajectory.
Noteworthy November
Sequential price growth for some food items like meat & fish, oils & fats fell while that of vegetables and pulses increased at a lower-than-expected rate. However, price momentum of the fuel and light category surprisingly fell. Average LPG (Liquefied Petroleum Gas) price across the four cities of Chennai, Delhi, Kolkata and Mumbai increased by 15.1% m/m in November but the official CPI reading for ‘LPG excluding conveyance’ picked up only by 0.2%. Although there is divergence every month between these, the 14.9ppt gap in November was the highest (Figure 1).
Despite the expected rise in electricity price due to widely-reported power issues, CPI for electricity price fell further by 3.2% m/m after -0.2% in October. Preliminary October WPI (Wholesale Price Index) reading for the electricity component spiked by 18.8% m/m (highest ever in the current WPI electricity series) but this was revised today to 0%. The reason for this large revision is not clear at the time of writing. Thus, the expected CPI-electricity increase did not materialise but the recent shift in direction of the WPI-CPI divergence here is noteworthy (Figure 2).
Further, momentum in CPI-petrol index typically tracks that in the real-time price data based on average across major cities and for the month. This gap also widened in November (Figure 3).
To understand the nature of divergence between WPI and CPI among the fuel items common to both indices, we construct a composite-fuel-index for WPI and CPI using only electricity, petrol, diesel, coal and LPG. The direction of divergence for the composite index has reversed from Jun21 and has also increased in the last few months (Figure 4).
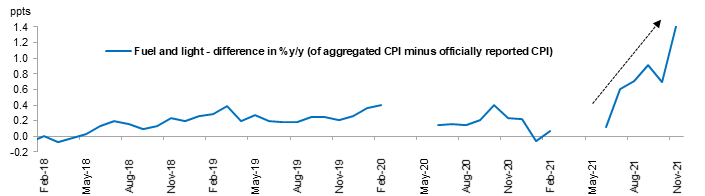
Interestingly, we notice that the fuel and light price index aggregated using its component data and weights (available from 2014) differs from the official index and the magnitude of this has increased more recently. The resulting difference in %y/y numbers (between aggregated and reported numbers) was the highest at +1.4ppt in November, up from +0.7ppt in October and the previous high of +0.9ppt in September (Figure 5).
Figure 1: LPG price divergence – higher than usual Figure 2: CPI-WPI divergence in electricity – direction changes
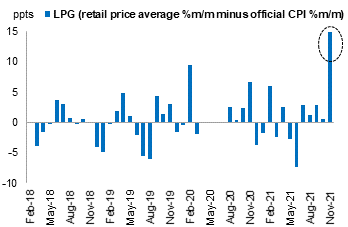

Figure 3: CPI-petrol vs. real time data diverges Figure 4: CPI-WPI divergence in common fuel basket picks up
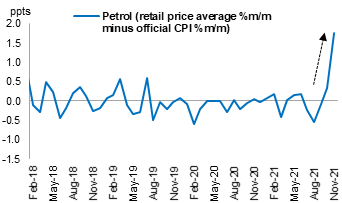
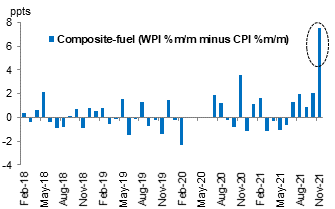
Figure 5: Fuel & light basket – aggregated vs. reported
Source for figures 1 to 5: CEIC, IDFC MF Research. Note: Some of the official data is not available for Mar-May 2020 and/or Mar-May 2021.
The candle
- Recollect that monthly momentum in core inflation has never been negative since the onset of the pandemic. Despite recorded lower sample size and issues in data collection, core CPI never corrected in subsequent months even after unusually strong readings in April 2020, July 2020 and May 2021. Cumulative momentum during April-November of FY21 and FY22 have been the highest since FY14.
- Higher core has been consistently very broad-based. Even in November, most core components registered higher momentum vs. October. Excise duty and VAT (Value-Added Tax) cuts on fuel doesn’t seem to have had an impact.
- Even alternative measures like CPI-ex-vegetables and CPI-ex-potato-onion-tomato have moved further up vs. core CPI and have been above 6% y/y for almost every month in FY22 (Figure 6).
- CPI goods-ex-food (30.8% weight in CPI) has picked up much more than goods (76.7% weight). Services ex-housing (13.3% weight) has been benign but momentum is inching up and broadly after the spike in May21 (Figure 7).
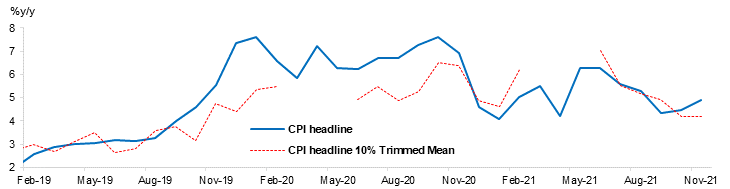
- The 10% Trimmed-mean-CPI was below the headline for most part of 2020 but is now closer to it (although headline y/y itself has moved lower also due to base effects), suggesting broader prices pressures (Figure 8).
- Even the percentage of total number of items in core-CPI experiencing positive m/m has picked up from an average of 77% in the June quarter to 80% in the September quarter and 89% during October-November. The trend is similar even when if look at weights instead of number of items.
Figure 6: CPI ex vegetables itself has been staying high

Figure 7: Goods ex-food picked up while services could rise
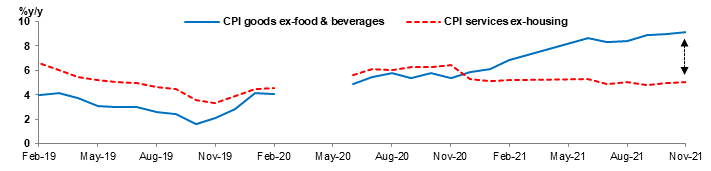
Figure 8: Trimmed mean CPI closer to headline in FY22 vs. FY21 when it was lower
Source for figures 6 to 8: CEIC, IDFC MF Research. Note: 1) Official y/y data is not available for Mar-May 2020 and Mar-May 2021, 2) 10% Trimmed Mean (TM) is based on 80% of the basket as it excludes 10% each of the highest and lowest y/y readings.
The wind
The ongoing easing in real-time vegetables prices should provide some comfort in the near term but there are several other significant factors which can tilt the net balance of core and thus headline inflation upward. These include:
- Tariff hikes announced by telecom companies – All the major telecom companies have announced 20-25% hikes mainly on prepaid plans from late-November or beginning of December. During H1 2017, when y/y growth in ARPUs (Average Revenue Per User) contracted, growth in CPI component on mobile charges fell but never turned negative on an average quarterly basis. However, during the Dec19 episode when telecom companies had announced hikes up to 42%, CPI component reflected a 9.2% m/m increase in Dec19 and another 2.2% in Jan20. Thus, if one takes the latter episode as reference, an almost immediate passthrough of the current hike could be expected.
- Electricity tariff hikes – As discussed, the narrative of power crunch implied a price rise and so did the October WPI data until it got heavily revised downward. Even the Nov21 WPI-Electricity print is now 0% m/m (after the revised 0% in Oct21). Thus, it is difficult to determine the exact passthrough to CPI but it cannot be completely ruled out.
- GST (Goods and Services Tax) rate hikes on clothing and apparel – The proposed Jan22 hike in GST rate from 5% to 12% on certain clothing and footwear below Rs. 1000 could also have an impact on CPI but again the magnitude and timing of passthrough to end-use products in the CPI basket could vary. This would also depend on the deliberations of the GST Council on rates as well as the compensation cess mechanism beyond Jun22.
- Oil price – Although prices fell recently, it has regained a good part of it and the future trajectory will depend on expected demand but the impact of lower investments in the oil industry on supply could also play out.
- Services inflation – This has started to pick up and could gather steam as demand recovers further. Some of the components within core-CPI like transportation, household services, recreation, etc. could further gain momentum due to this. Services inflation typically tends to be sticky and this could materialise at a time when core inflation has already remained high. Further, RBI’s research as per the Apr21 Monetary Policy Report suggests services inflation is the more durable component of the CPI and drives goods inflation over time.
- Price pressures and pass through to consumers – Supply-side bottlenecks continue to plague production worldwide, although it seems to have started to ease vey mildly quite recently. Asia PMI (Purchasing Managers’ Index) data suggests slightly slower electronic goods orders as demand for industrial electronics have also now started to slightly abate. General narrative also suggests companies could be inclined to pass on some amount of price rise to consumers to protect margins. WPI has picked up strongly, with the November reading up 14.2% y/y, a 2.7% m/m increase after 1.2% in October. Price momentum in primary articles (food, non-food, mineral, crude petroleum and natural gas) and core WPI (non-food-manufacturing) picked up. However, price of some non-oil commodities has started to slow (given the ongoing slowdown in China, etc.).
Thus, although the November CPI was below expectation, there seems to be higher divergence more recently when compared to real-time data and WPI. This was particularly visible in the Fuel and Light category, which also reported a lower-than-usual official index vs. when aggregated from components. Core inflation has remained high and sticky but this is now more broad-based and is clearly visible even in alternative measures. Various factors could push the future CPI trajectory upward although the exact timing and magnitude of the impact of some of these are not entirely clear. The spread of Covid infections and the Omicron variant could have its impact, but on both growth and inflation. For now, the wind is gathering.